Battery Intelligence · SoC & SoH
EV Battery — SoC & SoH
SoC = how full the battery is now. SoH = how healthy/capable it is compared with new. Keep them separate — never confuse “80% charged” with “80% healthy.”
How full is it now?
State of Charge tells you how much energy is currently available — the fuel gauge for today’s ride.
How healthy vs new?
State of Health tells you how much usable capacity has degraded compared with when the battery was new.
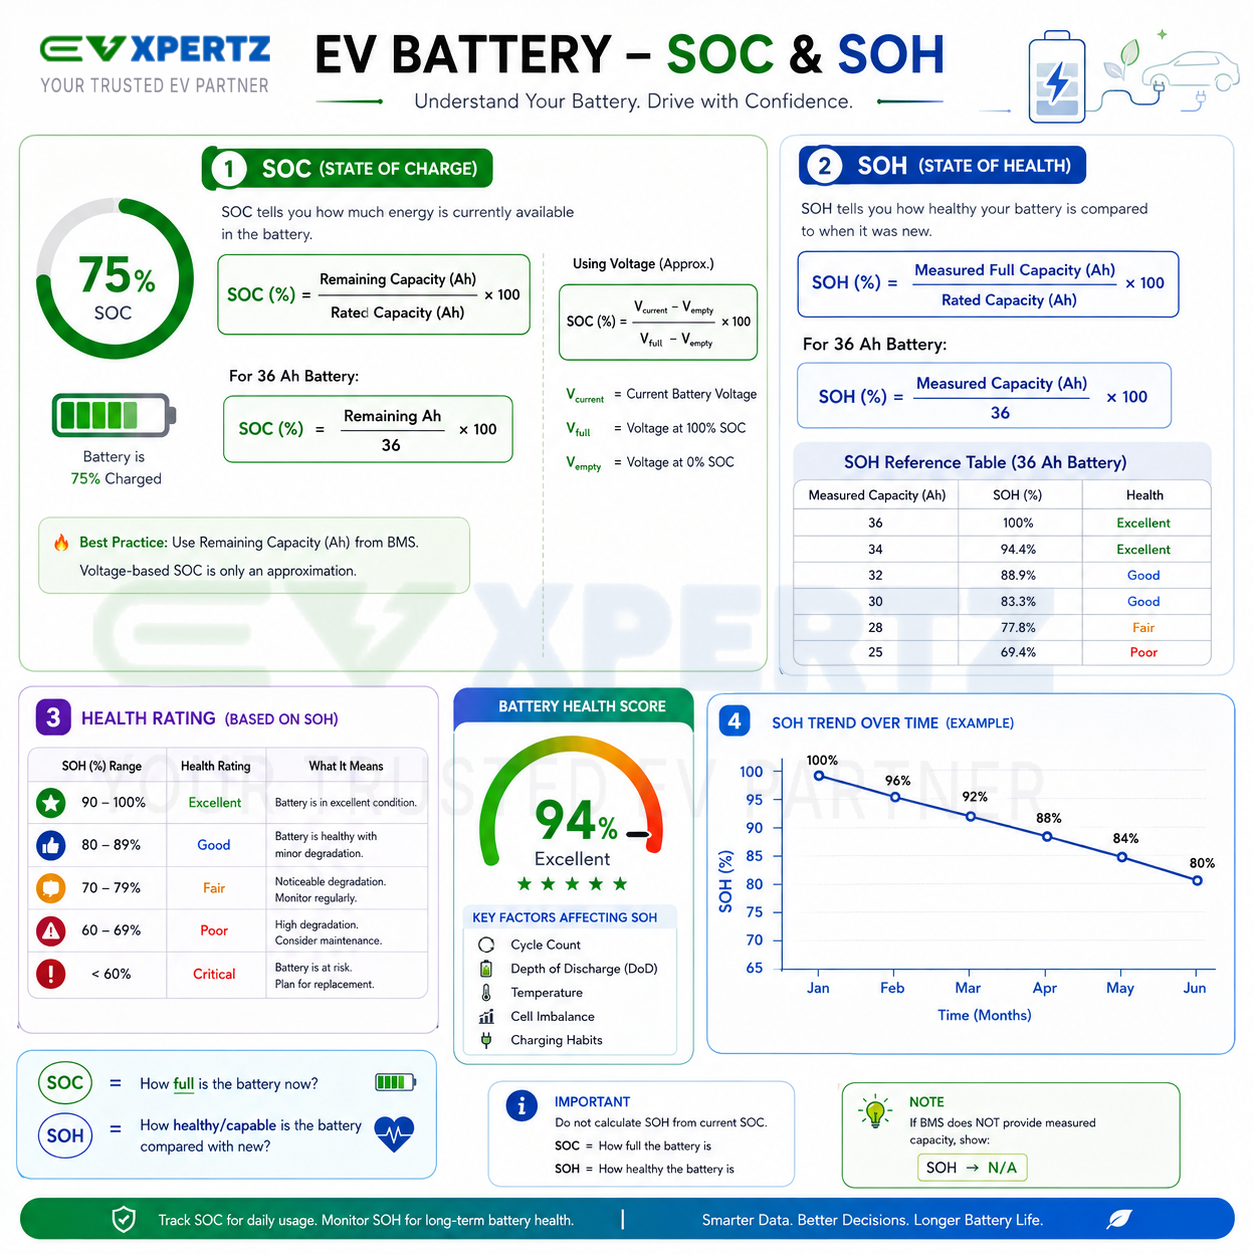
01 · SoC — State of Charge
SoC tells you how much energy is currently available. Prefer Ah from the BMS over voltage estimates.
Separate from health
This gauge shows charge only — not battery health. Example: 27 Ah remaining on a 36 Ah pack = 75% SoC.
SoC = 75.0%
Using ampere-hours (Ah)
SoC = Remaining Ah ÷ 36 × 100
If the BMS gives remaining capacity in Ah, this is preferable to estimating SoC from voltage.
If using voltage only
- Vcurrent — current voltage
- Vfull — voltage at 100%
- Vempty — voltage at 0%
Voltage-based SoC is only an approximation and depends heavily on battery chemistry, load and temperature.
02 · SoH — State of Health
SoH tells you how much the battery’s usable capacity has degraded compared with when it was new.
Most meaningful SoH
SoH = Measured Capacity ÷ 36 × 100
SoH = 94.0%
Important: don’t calculate SoH from the current SoC. SoC and SoH are different.
For BMS work: if the BMS does not expose actual measured capacity, report SoH: Not Available — never show 100% just because the battery is currently full.
HealthScore = SoH
EVXPERTZ recommends a Battery Health Score based primarily on SoH, with supporting factors such as cell imbalance, temperature, cycle count and voltage deviation.
Battery Health: 94% — Excellent
03 · Rating / health graph
Simple SoH bands for the dashboard — plus a 36 Ah capacity example table.
Based on SoH (HealthScore = SoH)
| SoH / HealthScore | Rating |
|---|---|
| 90–100% | Excellent |
| 80–89% | Good |
| 70–79% | Fair |
| 60–69% | Poor |
| < 60% | Critical |
Dashboard copy example: Battery Health: 94% — Excellent
Measured capacity → SoH
| Measured capacity | SoH |
|---|---|
| 36 Ah | 100% |
| 34 Ah | 94.4% |
| 32 Ah | 88.9% |
| 30 Ah | 83.3% |
| 28 Ah | 77.8% |
| 25 Ah | 69.4% |
Supporting factors for health score
Primary signal is SoH. Supporting context: cell imbalance, temperature, cycle count and voltage deviation.
04 · Historical graph — SoH % vs date
Show SoH % vs date (or cycle number) on the dashboard. Keep SoC as a separate live gauge so users never confuse “80% charged” with “80% healthy.”
SoH % over months
Educational example only (100% → 80%). Real packs vary by usage, climate and charging. Prefer SoH vs date or cycle number in production dashboards.
How full is the battery now?
Live gauge for daily range and charging decisions.
How healthy/capable vs new?
Health score + historical trend for long-term monitoring and replacement planning.
Track SoC daily. Monitor SoH for life.
Smarter data. Better decisions. Longer battery life — EVXPERTZ helps read SoC gauges and SoH health without mixing the two.